
- Home
- Latest News
![submenu-img]() Viral video: Kind man assists duck family in crossing the road, internet lauds him
Viral video: Kind man assists duck family in crossing the road, internet lauds him![submenu-img]() Can you see the Great Wall of China from space? here's the truth
Can you see the Great Wall of China from space? here's the truth![submenu-img]() Ashutosh Rana breaks silence on his deepfake video supporting a political party: 'I would only be answerable to...'
Ashutosh Rana breaks silence on his deepfake video supporting a political party: 'I would only be answerable to...'![submenu-img]() Meet India's most talented superstar, is actor, dancer, stuntman, singer, lyricist; not Ranbir, Shah Rukh, Aamir, Salman
Meet India's most talented superstar, is actor, dancer, stuntman, singer, lyricist; not Ranbir, Shah Rukh, Aamir, Salman![submenu-img]() This flop film was headlined by star kid, marked south actress's Bollywood debut, made in Rs 120 crore, earned just...
This flop film was headlined by star kid, marked south actress's Bollywood debut, made in Rs 120 crore, earned just...
- Election 2024
- Webstory
- IPL 2024
- DNA Verified
![submenu-img]() DNA Verified: Is CAA an anti-Muslim law? Centre terms news report as 'misleading'
DNA Verified: Is CAA an anti-Muslim law? Centre terms news report as 'misleading'![submenu-img]() DNA Verified: Lok Sabha Elections 2024 to be held on April 19? Know truth behind viral message
DNA Verified: Lok Sabha Elections 2024 to be held on April 19? Know truth behind viral message![submenu-img]() DNA Verified: Modi govt giving students free laptops under 'One Student One Laptop' scheme? Know truth here
DNA Verified: Modi govt giving students free laptops under 'One Student One Laptop' scheme? Know truth here![submenu-img]() DNA Verified: Shah Rukh Khan denies reports of his role in release of India's naval officers from Qatar
DNA Verified: Shah Rukh Khan denies reports of his role in release of India's naval officers from Qatar![submenu-img]() DNA Verified: Is govt providing Rs 1.6 lakh benefit to girls under PM Ladli Laxmi Yojana? Know truth
DNA Verified: Is govt providing Rs 1.6 lakh benefit to girls under PM Ladli Laxmi Yojana? Know truth
- DNA Her
- Photos
![submenu-img]() Aamir Khan, Naseeruddin Shah, Sonali Bendre celebrate 25 years of Sarfarosh, attend film's special screening
Aamir Khan, Naseeruddin Shah, Sonali Bendre celebrate 25 years of Sarfarosh, attend film's special screening![submenu-img]() Alia Bhatt wears elegant saree made by 163 people over 1965 hours to Met Gala 2024, fans call her ‘princess Jasmine’
Alia Bhatt wears elegant saree made by 163 people over 1965 hours to Met Gala 2024, fans call her ‘princess Jasmine’![submenu-img]() Jr NTR-Lakshmi Pranathi's 13th wedding anniversary: Here's how strangers became soulmates
Jr NTR-Lakshmi Pranathi's 13th wedding anniversary: Here's how strangers became soulmates![submenu-img]() Streaming This Week: Heeramandi, Shaitaan, Manjummel Boys, latest OTT releases to binge-watch
Streaming This Week: Heeramandi, Shaitaan, Manjummel Boys, latest OTT releases to binge-watch![submenu-img]() Remember Ayesha Kapur? Michelle from Black, here's how actress, nutrition coach, entrepreneur looks after 19 years
Remember Ayesha Kapur? Michelle from Black, here's how actress, nutrition coach, entrepreneur looks after 19 years
- Explainers
![submenu-img]() Haryana Political Crisis: Will 3 independent MLAs support withdrawal impact the present Nayab Saini led-BJP government?
Haryana Political Crisis: Will 3 independent MLAs support withdrawal impact the present Nayab Saini led-BJP government?![submenu-img]() DNA Explainer: Why Harvey Weinstein's rape conviction was overturned, will beleaguered Hollywood mogul get out of jail?
DNA Explainer: Why Harvey Weinstein's rape conviction was overturned, will beleaguered Hollywood mogul get out of jail?![submenu-img]() What is inheritance tax?
What is inheritance tax?![submenu-img]() DNA Explainer: What is cloud seeding which is blamed for wreaking havoc in Dubai?
DNA Explainer: What is cloud seeding which is blamed for wreaking havoc in Dubai?![submenu-img]() DNA Explainer: What is Israel's Arrow-3 defence system used to intercept Iran's missile attack?
DNA Explainer: What is Israel's Arrow-3 defence system used to intercept Iran's missile attack?
- Entertainment
![submenu-img]() Ashutosh Rana breaks silence on his deepfake video supporting a political party: 'I would only be answerable to...'
Ashutosh Rana breaks silence on his deepfake video supporting a political party: 'I would only be answerable to...'![submenu-img]() Meet India's most talented superstar, is actor, dancer, stuntman, singer, lyricist; not Ranbir, Shah Rukh, Aamir, Salman
Meet India's most talented superstar, is actor, dancer, stuntman, singer, lyricist; not Ranbir, Shah Rukh, Aamir, Salman![submenu-img]() This flop film was headlined by star kid, marked south actress's Bollywood debut, made in Rs 120 crore, earned just...
This flop film was headlined by star kid, marked south actress's Bollywood debut, made in Rs 120 crore, earned just...![submenu-img]() India's most successful star kid was superstar at 14, daughter of tawaif, affair with married star broke her, died at...
India's most successful star kid was superstar at 14, daughter of tawaif, affair with married star broke her, died at...![submenu-img]() India's biggest flop actor, worked with superstars, married girl half his age, once left Aamir's film midway due to..
India's biggest flop actor, worked with superstars, married girl half his age, once left Aamir's film midway due to..
- Sports
![submenu-img]() England pace legend James Anderson set to retire from Test cricket after talks with Brendon McCullum
England pace legend James Anderson set to retire from Test cricket after talks with Brendon McCullum![submenu-img]() IPL 2024: Shubman Gill, Sai Sudharsan centuries guide Gujarat Titans to 35-run win over Chennai Super Kings
IPL 2024: Shubman Gill, Sai Sudharsan centuries guide Gujarat Titans to 35-run win over Chennai Super Kings![submenu-img]() KKR vs MI IPL 2024: Predicted playing XI, live streaming details, weather and pitch report
KKR vs MI IPL 2024: Predicted playing XI, live streaming details, weather and pitch report![submenu-img]() 'It's ego-driven...': Ex-RCB star on Hardik Pandya's captaincy in IPL 2024
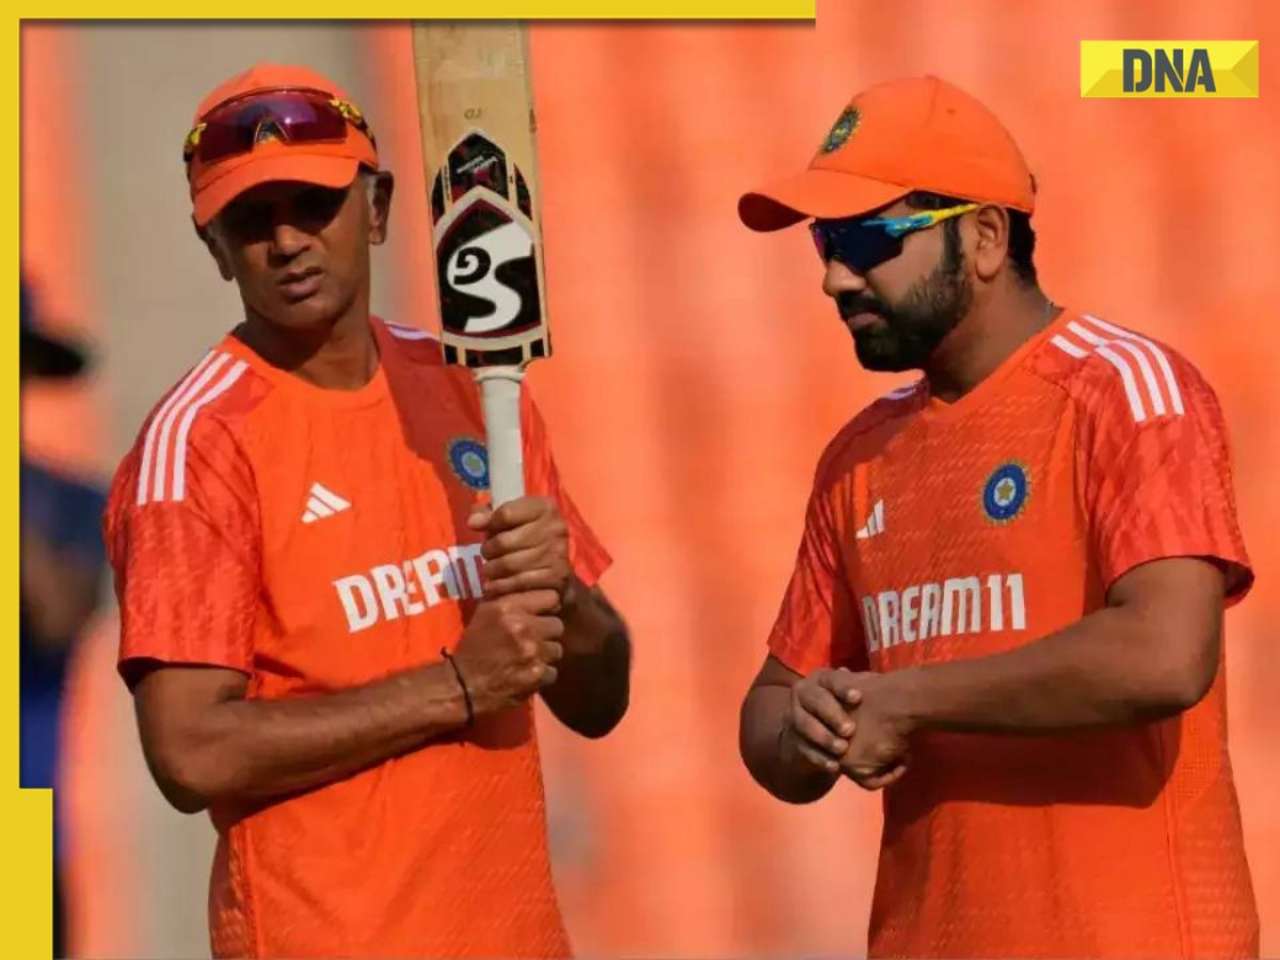
'It's ego-driven...': Ex-RCB star on Hardik Pandya's captaincy in IPL 2024![submenu-img]() BCCI to advertise for Team India's new head coach after T20 World Cup
BCCI to advertise for Team India's new head coach after T20 World Cup
- Viral News
![submenu-img]() Viral video: Kind man assists duck family in crossing the road, internet lauds him
Viral video: Kind man assists duck family in crossing the road, internet lauds him![submenu-img]() Can you see the Great Wall of China from space? here's the truth
Can you see the Great Wall of China from space? here's the truth![submenu-img]() Mother bear teaches cubs how to cross a road with caution, video goes viral
Mother bear teaches cubs how to cross a road with caution, video goes viral![submenu-img]() Meet the tawaif, real courtesan of Heeramandi, was once highest paid item girl, was killed by....
Meet the tawaif, real courtesan of Heeramandi, was once highest paid item girl, was killed by....![submenu-img]() Mukesh Ambani’s old image with billionaire friends go viral, Harsh Goenka makes joke of…
Mukesh Ambani’s old image with billionaire friends go viral, Harsh Goenka makes joke of…


 "Global average sea levels, sea levels, sea-level rise, global warming 2023, Rising Sea levels")


)
)
)
)
)
)