Reported By: | Edited By: Rahul Goswami |Source: DNA |Updated: Sep 30, 2014, 11:42 PM IST

From the first week of June 2014 until the middle of September 2014, there have been floods and conditions equivalent to drought in many districts. For India, the tale of monsoon 2014 comes from a reading of individual districts, not from a national ‘average’ or a ‘cumulative’.
Despite the advances made by our agencies in weather forecasting and climate monitoring, the science of meteorology still remains to be effectively distilled so that it can be used by citizens and, wherever possible, expanded and given context by ground-based observation and recording. One sector in which this does take place - albeit at a level still far below its potential - is agriculture. The reason is clear: our crop staples (cereals, pulses, vegetables and fruit) have their individual calendars for preparation, sowing, tending and harvesting.
And so we have an agricultural meteorology system that faithfully and reliably informs kisans and cultivators in 641 districts what to expect from the weather for the next week. Thanks to mobile phones, weather alerts and crop advisories are distributed in all our major languages to a portion of the farming households working on 138 million farm holdings, (of which 117 million are small). But this is still only a portion, and is far from adequate in distributing the results of the work of our earth scientists and field staff.
Moreover, every other sector of development requires such raw data and location-specific analysis: the Department of Rural Development, the National Rural Health Mission, the Nirmal Bharat Abhiyan (for drinking water and sanitation), food-based programmes (like the mid-day meals) for which the availability of ingredients and their supply is the essence of their work, the Central Water Commission and the Central Ground Water Board, whose work it is to determine the water flows and balances in river sub-basins and watersheds (there are 3,257), and districts administrations (which administer 232,855 panchayats) and municipal councils alike which must implement relief measures when drought sets in or must ration supply when there are shortages. This is but a small list of agencies whose work is directly affected by the Indian summer monsoon and its activity to where they work.
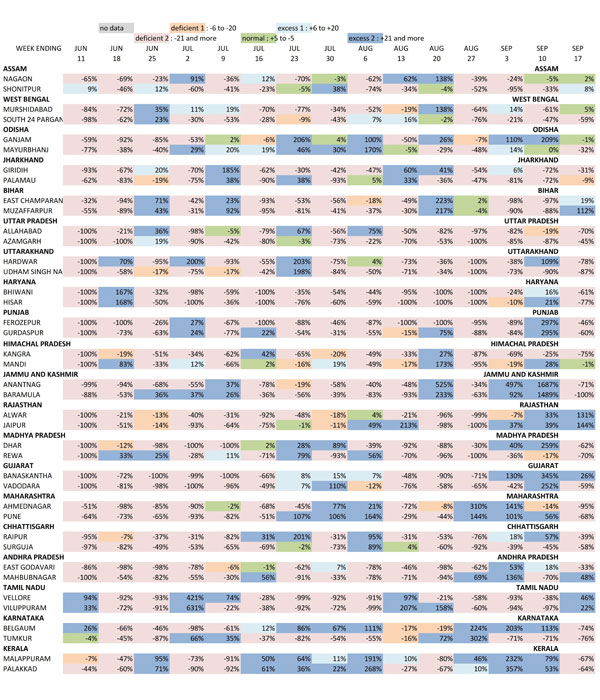
This table illustrates the trend of weekly rainfall in 40 districts. These districts are selected as being home to the largest rural populations, two from the 20 major states (by population). The numbers by week and district describe how far from a 'normal' the recorded rainfall for that week was.
Several overall observations stand out. Districts with weeks coloured light rose dominate, for these show those that received much less rain than they should have. Districts with a shade of deeper blue are the next most frequent category, and those received excess rain. Taken together, this tells us that extremes - very much less or more - were common for this group of districts in India with large rural populations.
We can see the prolonged dry spells for districts in Haryana and Punjab; likewise the absence of rain for the first six monsoon weeks in Gujarat and Maharashtra; are examples of wide swings around weekly 'normal' in Giridih (Jharkhand), Muzaffarpur (Bihar), Haridwar (Uttarakhand), Mandi (Himachal Pradesh), Viluppuram (Tamil Nadu), and Mahbubnagar (Andhra Pradesh). The weeks ending 20 August in Bihar and the weeks ending September 3 and 10 in Jammu and Kashmir immediately stand out - the Kosi had breached its banks in Bihar and the Chenab submerged Srinagar and Jammu.
A dense network of weather stations (more of these are being automated every month, but every taluka still does not have one) is complemented by dedicated satellites which provide continuous coverage of the sub-continent, the northern Asian land mass, the surrounding oceans southwards until beyond the Tropic of Capricorn. Methods to simply and accurately funnel this stream of real-time data and imagery are available, mostly at no cost, in order to aid local administrations, farmers and cultivators, and all citizens. It is this availability and relative simplicity of use (block-level weather forecasts for 72 hours are now available as local language apps on smartphones) that must be encouraged by the official agencies - for they simply do not have the persons to do so at the scale and detail required.
Consider the setting in early July 2014. India's summer monsoon was already late, and where it was late but active it was weak (as shown by the chart). The indications from the central earth science agencies (including the India Meteorological Department), from the Indian Institute of Tropical Meteorology, from the National Centre for Medium Range Weather Forecasting were that it would be end-June before the summer monsoon system settles over central India and the western Gangetic plains. This did not happen for another two weeks, until six of the usual 16 monsoon weeks had passed.
When in mid-July more rainfall was recorded in the districts, even then, as the chart shows, only 50% of the districts reached their 'normals' for that week only. Thereafter, the volatility of rainfall set in and while for those in our towns and cities there was relief from the searing summer temperatures the rains did not assure sowing conditions for farmers and cultivators, nor did it add, in July, to the stores of water in major and minor reservoirs.
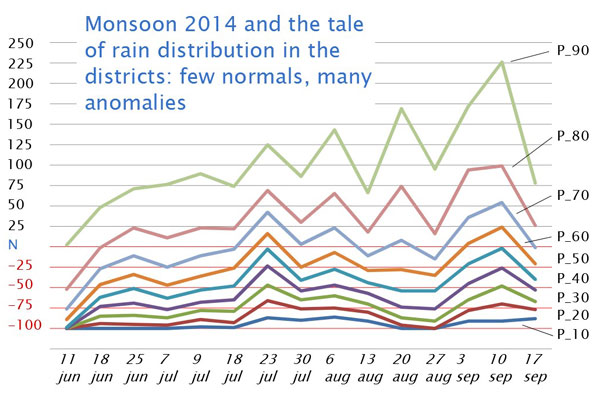
This line chart tells some of the tale. It shows that for the first six weeks of monsoon 2014, most districts recorded rain below their ‘normals’ for those weeks. The lines are percentile lines; they tell us what percent of districts recorded how much rainfall in a monsoon week relative to their normals for that week. This chart does not show how much rain – it shows distance away from a weekly normal for districts.
The left scale is a percentage – higher percentages indicate how far above normal districts recorded their rainfall, negative numbers show us how far below normal their rainfall was. The dates (the bottom scale) are for weeks ending on that date for which normals and departures from normal were recorded. The P_01 to P_09 lines are the percentiles (10th to 90th) of all districts in every week.
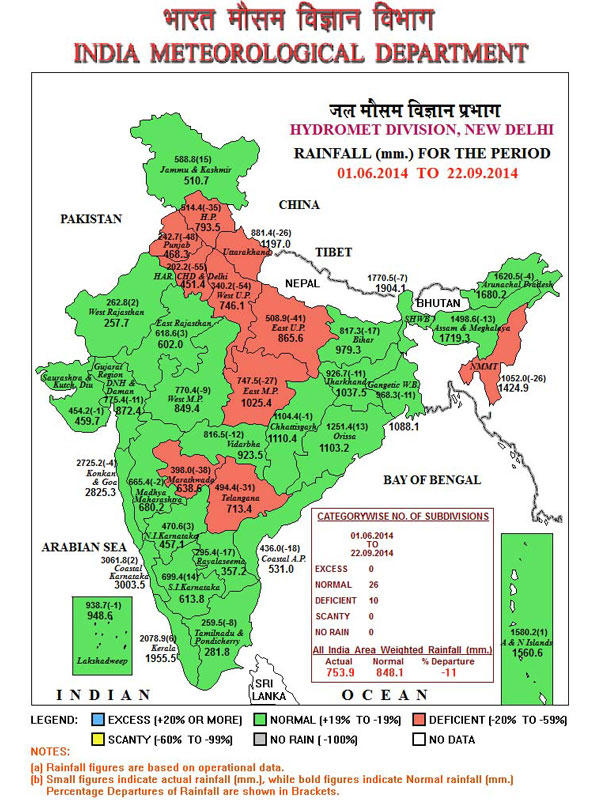
That is why the IMD's outdated and stodgy public outreach practice must be overhauled, completely. The bland map (see example) of sub-divisions is of little use when what we want to know pertains to tehsil and town. The Met Department's rain adequacy categories must be replaced too by measures that are geared towards aiding alerts and advisories - 'normal' is rainfall up to +19% above a given period's average and also down to -19% from that same average, a range that can make or break the efforts of a horticulturist. Likewise, excess is +20% and more, deficient is -20% to -59% and scanty is -60% to -99%. To illustrate how misleading these categories can be, the difference between an excess of +21% and +41% can be the difference between water enough to puddle rice fields and a river breaking its banks to ruin those fields.
The typical IMD map of ‘normal’ rainfall measured by the meteorological sub-divisions. The detailed weekly tables give us a very different picture.
The yawning gap between the technical competence of India's climate monitoring systems, and the ways in which they are used, must be bridged and this is best done through public participation and citizen initiative. The politics of monsoon and of water will continue, but must not be allowed to define how our systems are used. Nor must they detract from our long history of weather observation, which dates back at least to the 'Vrhat Sanhita' of Varahamihira.
It has only signalled policy confusion for central and state governments to have not declared districts and talukas as affected by drought - which they should have by late July 2014 - while at the same time quietly announcing to administrations, as the Ministry of Agriculture did, that "to deal with challenges posed by delayed and aberrant monsoon and in the wake of shortfall in sowing of major crops during kharif 2014, the government has initiated interventions". These being a diesel subsidy for what is called 'protective irrigation' of crops, raising the ceiling on the seed subsidy, rolling out a drought mitigating programme for horticulture, boosting fodder cultivation through the flagship Rashtriya Krishi Vikas Yojana.
The new government has stated time and again its desire to improve and strengthen governance. This must come to include a concerted drive to democratise the use of public domain information, including our monsoon and water, in order that residents of 4,041 statutory towns (large cities included) and 3,894 census towns can judge the relationships between the food we buy, the rain we receive, our individual use of about 70 litres of water a day, and the fluctuation of these trends from one monsoon to another. The moral of monsoon 2014 is that we must reclaim local measures for local use.
The author worked for the National Agriculture Innovation Project, and is a researcher of food systems and agricultural policy (makanaka@pobox.com)