Reported By: | Edited By: Bibek Debroy,Kishore Desai |Source: DNA |Updated: Mar 07, 2017, 08:05 AM IST
The Prime Minister announced demonetization on November 8, 2016, at 8:00 pm. Shortly after the announcement, media agencies reported huge gold purchases across major cities. Unofficial reports suggest that about 20 per cent of average monthly sales happened just within a few hours (8:00 pm till around midnight). That was not surprising. The country’s appetite for gold is well known. For years, India was the world’s largest consumer of gold, till China overtook it a couple of years back. Gold is purchased for both consumption (in the form of jewelry, personal use) and investment/saving purposes. A part of this consumption may well be for converting unaccounted “cash”. As the bulk of the gold supply is met through imports, an increase in gold demand typically pushes up the current account deficit. But there is a statistical aspect that many of us have not paid attention to.
An increase in gold consumption inflates estimates of Gross Capital Formation as well. Here’s how:
As per the “National Accounts Statistics - Sources and Methods 2012” released by the Central Statistics Office (CSO), the expenditure estimate of GDP comprises: a) Consumption Expenditure (Government Final Consumption Expenditure + Private Final Consumption Expenditure); b) Gross Capital Formation (GCF) (comprising Gross Fixed Capital Formation (GFCF), Changes in stocks (CIS) and Valuables); and c) Net exports. Within this, Gross Capital Formation (GCF) is meant to measure capital formation/investment activities. An increase in GCF would mean that the economy is adding productive capital assets (buildings, equipment, machinery, other assets). These capital assets could be used to produce more goods and income for the country in the future. Similarly, an increase in the ratio of GCF to GDP would mean that the rate of addition of such productive assets is more than the rate of GDP increase – a positive trend for an economy.
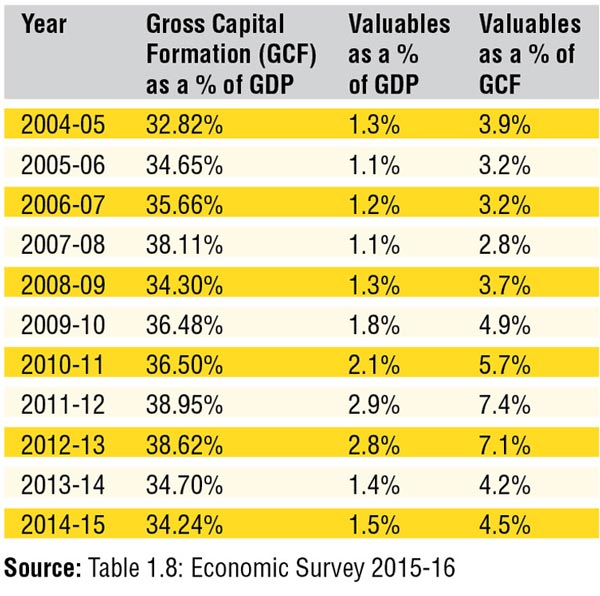
Data in current prices. 2004-05 to 2010-11 in 2004-05 series and data for 2011-12 onwards in 2011-12 series
However, this is not as straightforward as it sounds. At least, for India, there’s a catch due to inclusion of Valuables in estimating GCF. As per the United Nations System of National Accounts (UNSNA 1993 and 2008) guidelines, Valuables generally includes precious metals (gold, diamond, silver, platinum), stones, antiques, paintings, sculptures, other art objects, and jewelry. Further, gold held by the Central Bank /Reserve Bank is not taken as ‘Valuables’. Considering India’s case (large consumption for non-productive purposes), these valuables do not add to Indian economy’s productive potential. And thus inflates GCF estimates.
Consequently, whether Valuables should be included in GCF is itself debatable. RBI had released a paper titled “Treatment of Valuables as Capital formation in India: Some issues and perspectives” in 2011. The paper questions the correctness of including “valuables”. It argues “….If the ‘valuables’ are included as part of GCF, there ought to be a counterpart in savings to finance such investment. However, household saving in India is not directly estimated as the difference between household income and consumption; it is done indirectly with the estimates of saving in the form of financial and physical assets without taking into account ‘valuables’. Hence, net acquisition of ‘valuables’ gets completely ignored in the CSO’s saving estimation procedure. Finally, this contradicts the UNSNA 1993 where ‘valuables’ ought not to be treated as part of consumption. To be consistent, an equivalent amount of ‘valuables’ has to be added to the domestic savings. Overall, both conceptually and from the point of view of its operational significance, it may not be appropriate to include “acquisitions of valuables” as part of GCF”.
The table (inset) provides trends of GCF as a share of GDP, Valuables as a share of GDP and valuables as a share of GCF in India.
As can be seen in the table, over the period 2004-05 to 2014-15, GCF/GDP ratio peaked at 38.95 per cent in the year 2011-12. Since 2011-12, this has been consistently declining and reached about 34.24 per cent in 2014-15: a decrease of about 4.7 per cent. Interestingly, the share of Valuables to GDP also peaked in the year 2011-12 reaching about 2.9 per cent. Besides this, the share of Valuables within GCF also peaked to 7.4 per cent in the same year. A large part of the increase in “capital formation” in that period was therefore illusory. It did not reflect the true picture of investment activity in the country. In particular, note the increase between 2009-10 and 2012-13.
The authors are economists with the Niti Ayog. Views personal.