Reported By: | Edited By: R N Bhaskar |Source: DNA |Updated: Jun 17, 2014, 02:44 PM IST
Commodity markets are jittery. They fear the Iraq unrest could result in major spikes in oil prices. And this nervousness appears to have spread to stock markets as well, making them skittish too. If media reports are to be believed, this anxiety has even begun to spread to governments, especially the Indian government. After all, oil price hikes can be major contributors to inflation.
The big question is, will the Iraq crisis end?
However, maybe, they should be asking another question. Should the Iraq unrest cause a spurt in oil prices?
To understand why this question is relevant, one must first realise that Iraq is not one of the top five oil producers in the world. It used to be a significant player. But that was when Saddam Hussein was at the helm of affairs. It was before the US chose to invade Iraq, which is the root cause for the current unrest.
Today, as the table alongside will show, Iraq is the 7th largest producer. It produces just 3.4 million barrels of oil daily, compared to 11 million for Russia and 9.9 million for Saudi Arabia. Moreover, Saudia Arabia has the swing capacity to make up for any loss of production in Iraq. Alternatively, Iran, which produced some 4.23 million barrels daily in 2013 could easily move into the breech, but only if the US allows it to.
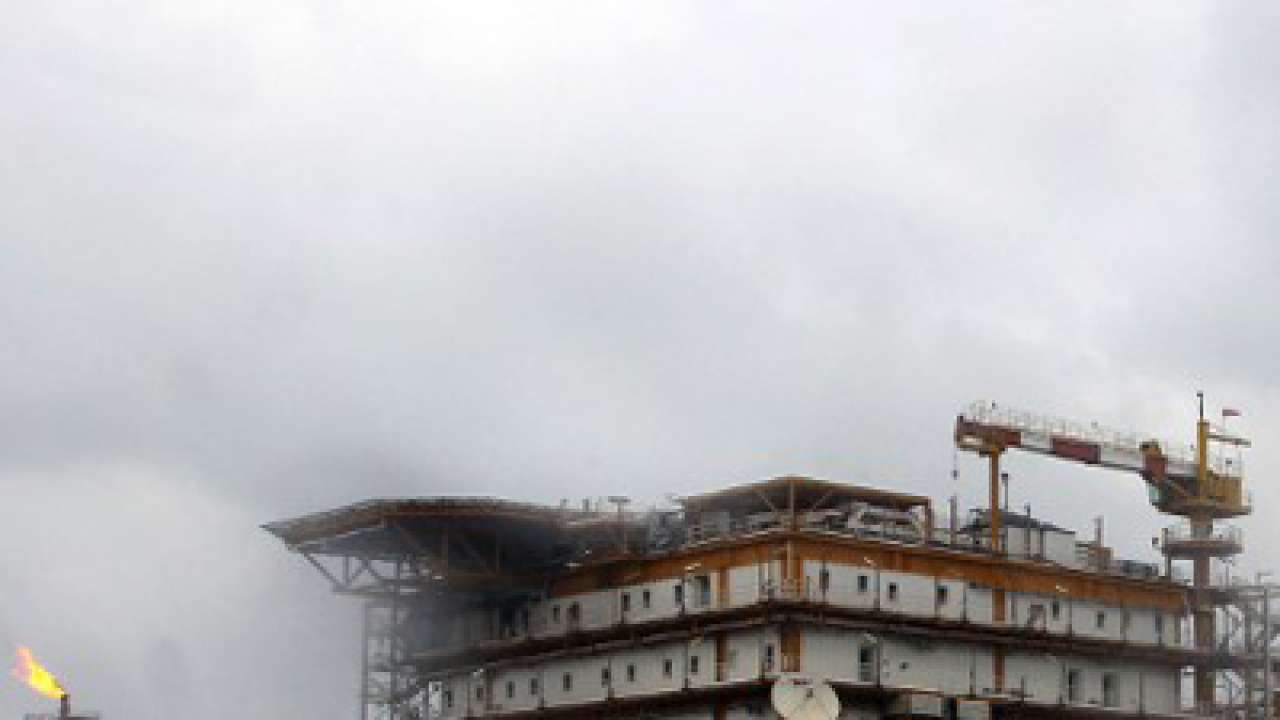
There is a second aspect to the Iraq production. The entire fighting between Iraqi forces and the rebels is in North Iraq. The oil installations and the ports are to the west and to the south. Supply of oil to the world has not been disrupted (as yet).
So, why the panic? To understand this, one needs to know that the oil industry is governed as much by the dynamics of demand and supply as well as perception. The perception part of the market is deftly controlled by some of the largest speculators, including major oil companies. The best example of this can be found in this article, which deals with a piquant situation where the world found that not a single oil tanker was available.
The article shows how the biggest and most secretive gathering of ships in maritime history lies at anchor east of Singapore. Never before photographed, it is bigger than the US and British navies combined, but has no crew, no cargo and no destination – and is why your Christmas stocking may be on the light side this year. It was when some very intrepid analysts pointed out that most of the oil tankers were full to the brim, laden with oil, and yet going nowhere. This was being done because the cost of chartering an oil tanker was lower than the price escalation on a day to day basis.
All the oil tankers had collectively become secret hoarders of oil, in an attempt to create a scare and cause a runaway price increase on a day to day basis. Do recall how oil prices climbed from $31 per barrel in Dec 2008 to $79 in 2009. Curiously, the US did not speak about such hoarders or speculators, and just turned a blind eye to such market manipulations. One reason possibly could be that the eventual beneficiaries were Texas-based oil companies which have a major stake in the global oil drilling business, especially in Middle East countries.
Then take the actual oil prices during the past two months. Data gleaned from the US Energy Information Administration (EIA) shows how oil prices have fluctuated between $105.34 on March 3, 2014 to $105.09 on June 9, 2014. That cannot be called a price increase. But the rumours could be harbingers to an increase in prices if the speculators are allowed to have their way.
A lot will depend on the seriousness with which the US moves in to stop this civil war from escalating. After all, the US is responsible for this in many ways. First, by removing Saddam Hussein, even when there was no proof of weapons of mass destruction (WMD). Second, for allowing over 600,000 people to get killed (according to a comprehensive survey done by the prestigious Lancet), a number far bigger than the 30,000 claimed by the US. And third, because the rebels have gained access to weaponry which could only have come from the supplies the US and its allies made to rebels in Libya and Syria.
Will the US move in to stop further bloodshed? Or will it cave in to the speculative demands of the US oil industry. The answer to that will determine the course of oil prices and stability in the Middle East.
|
Country ranking in oil production – 2013 |
|||
|
|
|||
|
Rank |
Country |
Production (bbl/day) |
Share of |
|
— |
World |
848,20,000 |
100.00% |
|
1 |
Russia |
109,00,000 |
13.28% |
|
2 |
99,00,000 |
12.65% |
|
|
3 |
84,53,000 |
9.97% |
|
|
4 |
42,31,000 |
4.77% |
|
|
5 |
40,73,000 |
4.56% |
|
|
6 |
35,92,000 |
3.90% |
|
|
7 |
34,00,000 |
3.75% |
|
|
8 |
30,87,000 |
3.32% |
|
|
9 |
30,23,000 |
3.56% |
|
|
10 |
29,34,000 |
3.56% |
|
|
11 |
26,82,000 |
2.96% |
|
|
12 |
26,33,000 |
3.05% |
|
|
13 |
25,25,000 |
2.62% |
|
|
14 |
19,98,000 |
2.79% |
|
|
15 |
18,85,000 |
2.52% |
|
|
16 |
18,40,000 |
2.31% |
|
|
17 |
16,35,000 |
1.83% |
|
|
18 |
16,31,000 |
1.44% |
|
|
19 |
10,99,000 |
1.78% |
|
|
20 |
10,11,992 |
0.97% |
|
Source: List of countries by oil production 2013 estimates on Wikipedia
|
Cushing, OK WTI Spot Price FOB (Dollars per Barrel) |
||||||
|
Week Of |
Mon |
Tue |
Wed |
Thu |
Fri |
|
|
1988 Apr-18 to Apr-22 |
18.5 |
17.92 |
17.93 |
18.34 |
18.13 |
|
|
1988 Apr-25 to Apr-29 |
18.36 |
18.54 |
18.32 |
17.91 |
18.1 |
|
|
1988 May- 2 to May- 6 |
17.12 |
17.3 |
17.23 |
17.41 |
17.63 |
|
|
1988 May- 9 to May-13 |
17.56 |
17.5 |
17.48 |
17.49 |
17.53 |
|
|
1988 May-16 to May-20 |
17.7 |
17.72 |
17.39 |
17.43 |
17.41 |
|
|
1988 May-23 to May-27 |
17.01 |
17.04 |
17.39 |
17.54 |
17.45 |
|
|
1988 May-30 to Jun- 3 |
17.45 |
17.54 |
17.6 |
17.67 |
17.51 |
|
|
1988 Jun- 6 to Jun-10 |
17.28 |
17.32 |
17.35 |
17.09 |
16.7 |
|
|
1988 Jun-13 to Jun-17 |
16.43 |
16.85 |
16.56 |
16.62 |
16.43 |
|
|
1988 Jun-20 to Jun-24 |
16.02 |
15.82 |
16.03 |
15.86 |
16.03 |
|
For full data, read here.