Reported By: | Edited By: Bibek Debroy,Kishore Desai |Source: DNA |Updated: Jan 24, 2017, 08:10 AM IST
Why does one hold money? Without muddying waters too much, it is either to undertake transactions, or because there is some speculative motive associated with assets. Waters can also be muddied about definition of ‘money’. Let us interpret it in the sense of currency (notes plus coins) with the public; what economists call ‘narrow money’. Currency with public is excessively high in India. It is high in comparison with not just developed economies, but also economies in South Asia and the cash/GDP ratio has increased over time. Consequent to November 8, 2016, an argument is often advanced that economic activity and GDP will suffer because of currency shortages. The reference is to the short-term, because the shortage is also short-term in nature. Any short-term effects are also likely to be more than compensated by efficiency and other gains over the medium-term, such as lower growth in 2016-17 more than compensated by higher growth in 2017-18. While we do not discount the short-term shock and adverse impact, implicit in the argument is a presumption that all currency is required for facilitating output growth. In essence, this is some form of the quantity theory of money hypothesis. With a constant velocity of circulation, nominal demand for money is a function of the nominal level of output. If the supply of money is restricted, output and growth have to suffer.
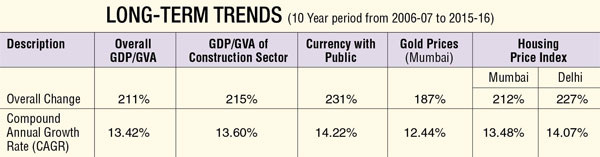
RBI publishes data on currency with public on March 31 of every financial year. Between 2006-07 and 2015-16, this increased at a compound annual rate of growth of 14.22 per cent. Since this is a compound annual growth rate (CAGR), which blows the effect up over time, this amounts to an absolute increase of 231 per cent. Let us presume this was required for output and GDP growth. There is a minor data issue. Till 2010-11, data are for GDP at factor cost. From 2011-12, data are for GVA (gross value added). We have done minor adjustments to get a continuous series in current prices for the entire 10-year period. The CAGR for GDP/GVA is 13.42 per cent and the absolute increase in GDP/GVA is 211 per cent. The increase in currency with public was disproportionate. Hence, all of that currency with public was not required for GDP/GVA transactions. Something else was going on. But perhaps one needs some refining to make the argument convincing. Perhaps it was not just about overall GDP/GVA growth, but the composition of that growth too. For instance, some sectors may be more prone to use of cash. Among such sectors, land/real estate is invariably mentioned. For this, one needs a surrogate indicator from natural accounts statistics. The natural one is GDP/GVA contributed by the construction sector. The CAGR for this was 13.60 per cent and the absolute increase 215 per cent. Here too, the currency increase is disproportionate.
That surrogate construction sector indicator can be supplemented with a housing price index, available for Mumbai and Delhi. Till 2007-08, this is available in budget documents and subsequently, through the RBI. There are some statistical adjustments one has to do to get a complete series, such as base year changes and constructing chain indices. As the table shows, that does not change the conclusion either, whether one uses Mumbai or Delhi. The increase in currency with public is still disproportionate. We next tinkered with another sector supposedly prone to cash transactions, the gold market.
RBI gives data on gold prices in Mumbai (per 10 grams). As the table shows, this does not offer a satisfactory explanation. Let’s state this a bit differently. A certain growth in cash was required to ensure GDP/GVA growth was facilitated. However, the increase in cash was in excess of this. What was the reason for this excess growth? We can think of only two explanations. First, that cash was for transactions that are transfer payments from the point of view of GDP/GVA.
For instance, a property transaction is a transfer payment. It does not add to GDP/GVA. Second, the excess cash was for transactions that don’t show up in GDP/GVA, which can only capture legitimate or legal numbers. For instance, a housing price index will be based on the registered (white) value of a house. It won’t take into account the illegal (black) segment. This extrapolation from the past has a present angle. November 8, 2016, sucked out a certain stock of cash from the system, albeit temporarily. But that entire amount was not required for output growth, a point worth remembering when people try to estimate GDP/GVA contraction as a result of that shock.
Perhaps more importantly, that excess cash need not be pumped back into the system.
The authors are economists with NITI Aayog. Views personal.